15.1 How fast are population responses?
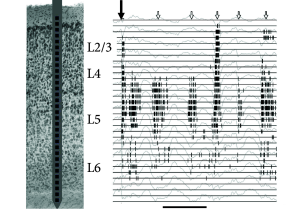
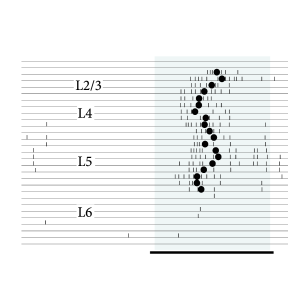
Simultaneous measurements from many neurons in vivo with spike-time resolution are difficult. Fig. 15.2 shows two examples of simultaneous recordings across different layers in primary auditory cortex. Each of the 32 recording sites is able to pick up activity of several neurons (Fig. 15.2A). The group of recorded neurons in layer IV responds to a short tone stimulus with a delay of about 15 ms (Fig. 15.2B), the neurons in other layers follow shortly thereafter. Based on several such experiments, we may conclude that population activity in layer IV exhibits an initial sharp peak less than 20ms after stimulus onset (453). Unfortunately, the number of neurons that are recorded simultaneously in one layer is limited so that an interpretation in terms of population activity is difficult; nevertheless, the data suggests that transients can be fast and reliable on the time scale of 10ms.
| A | B |
|---|---|
|
 |
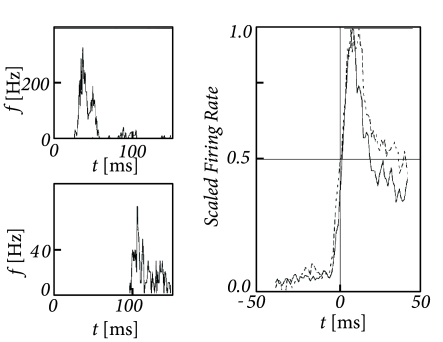
Alternatively, one can attempt to study population activity across many experiments with single-neuron recordings. Neurons in visual cortex V1 and V4 respond reliably to the onset of spatial gratings (Fig. 15.3), as seen in the PSTH accumulated over several repetitions of the stimulus presentation (331). However, different neurons have different delays. If the PSTHs from many neurons are aligned onto the moment of the sharp rise of the PSTH response, then the resulting population activity exhibits an extremely sharp and abrupt onset peak, followed by a rapid decrease (331). However, if the responses of different cells were aligned on the moment of stimulus onset, then the population response would look slower, which is not surprising given that the recordings do not come from a single homogeneous population.
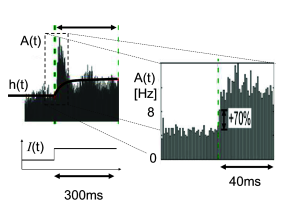
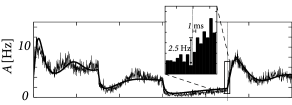
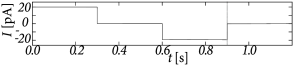
In an in vitro preparation, the same step current input can be repeatedly given to the same neuron. In order to mimic additional stochastic spike arrivals that would be present in vivo, during each repetition a different realization of a noisy current can be added to the step current. Fig. 15.4 shows the response of pyramidal neurons in cortical layer 2/3, to such noisy step inputs, averaged over 12 different cells. The population activity in Fig. 15.4A exhibits a rapid transient, followed by a strongly damped oscillation (509). As we will see in the following sections, the oscillatory component indicates that the noise level of the stochastic input component was chosen fairly low. For low noise, those neurons that fire together at stimulus onset, enter together into a state of refractoriness and fire again after a time corresponding to the mean interspike interval. We can therefore conclude that populations of neurons in vitro exhibit, in the regime of low noise, a sharp transient, indicating a very fast response to step current input.
The theory of population activity (Fig. 15.4B) enables us to understand the responses found in the experiments, as we will see in the next section.
| A | B |
|---|---|
|
|
 |