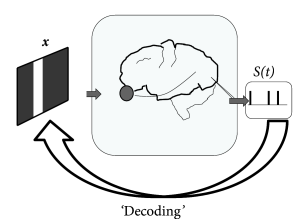
11.3 Decoding
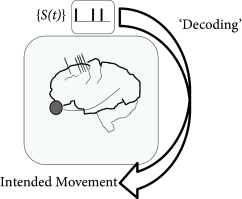
‘Decoding’ refers to the problem of how to ‘read out’ the information contained in a set of neural spike trains (Fig. 11.9) and has both theoretical and practical implications for the study of neural coding (437; 130). A variety of statistical techniques have been applied to this problem (437; 74; 400; 10); in this section, we focus specifically on decoding methods that rely on Bayesian ‘inversion’ of the generalized linear encoding model discussed above and in Chapter 10. That is, we apply Bayes’ rule to obtain the posterior probability of the stimulus, conditional on the observed response:
| (11.13) |
where is the prior stimulus probability. As an aside we note that a similar idea was used above when we incorporated prior knowledge to regularize our estimates of the encoding model parameter ; here we are assuming that , or equivalently , has already been estimated to a reasonable degree of precision, and now we want to incorporate our prior knowledge of the stimulus .
The primary appeal of such Bayesian decoding methods is that they are optimal if we assume that the encoding model is correct. Decoding therefore serves as a means for probing which aspects of the stimulus are preserved by the response, and also as a tool for comparing different encoding models. For example, we can decode a spike train using different models (e.g., including vs. ignoring spike-history effects) and examine which encoding model allows us to best decode the true stimulus (398). Such a test may in principle give a different outcome than a comparison which focuses on the encoding model’s ability to predict spike train statistics. In the following, we illustrate how to decode using the stimulus which maximizes the posterior distribution , and show how a simple approximation to this posterior allows us to estimate how much information the spike train response carries about the stimulus.
11.3.1 Maximum a posteriori decoding
The Maximum A Posteriori (MAP) estimate is the stimulus that is most probable given the observed spike response , i.e., the that maximizes . Computing the MAP estimate for once again requires that we search in a high-dimensional space (the space of all possible stimuli ) to find the maximizer of a nonlinear function, . Luckily, in the GLM, the stimulus interacts linearly with the model parameters , implying that concavity of the log-likelihood with respect to holds under exactly the same conditions as does concavity in (383). Moreover, the sum of two concave functions is concave, so the log-posterior,
| (11.14) |
is concave as long as the stimulus log-prior is itself a concave function of (e.g. is Gaussian). In this case, again, we may easily compute by numerically ascending the function .
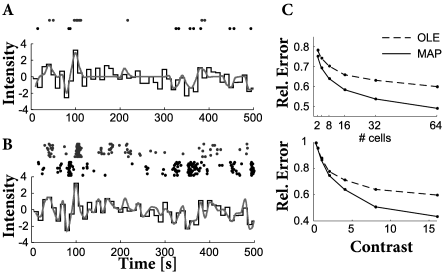
We emphasize that the MAP estimate of the stimulus is, in general, a nonlinear function of the observed spiking data . As an empirical test of the MAP estimate, we can compare its performance with that of the optimal linear estimate (OLE, see example below), the best linear estimate of the stimulus as a function of the observed spiking data (437).
Figure 11.10 shows a comparison of the two decoding techniques, given responses generated by a GLM encoding model with known parameters, as a function of stimulus contrast (variance) and size of the neuronal population. The MAP clearly outperforms the OLE at high contrasts or large population sizes. More importantly, the MAP approach provides us with a great deal of flexibility in considering different encoding models or prior distributions: we can simply substitute in a new or and recompute the MAP estimator, without having to obtain new estimates of the regression parameters as required by the OLE; see (415) for an example of this type of analysis. Finally, there are close connections between MAP decoding and the optimal control of neural spiking; see (11) for further discussion.
Example: Linear stimulus Reconstruction
We predict the stimulus by linear filtering of the observed spike times ,
| (11.15) |
where the sum runs over all spike times. The aim is to find the shape of the filter , i.e., the optimal linear estimator (OLE) of the stimulus (437).
Parameters of the OLE can be obtained using standard least-squares regression of the spiking data onto the stimulus . To do so, we discretize time and the temporal filter . Mathematically, the optimization problem is then essentially the same as above where we aimed at predicting spikes by a linear model of the stimulus (Section 10.2). The only difference is that here we are regressing the spikes onto the stimulus, whereas previously we were regressing the stimulus onto the spike response.
11.3.2 Assessing decoding uncertainty (*)
In addition to providing a reliable estimate of the stimulus underlying a set of spike responses, computing the MAP estimate gives us easy access to several important quantities for analyzing the neural code. In particular, the variance of the posterior distribution around tells us something about which stimulus features are best encoded by the response . For example, along stimulus axes where the posterior has small variance (i.e. the posterior declines rapidly as we move away from ), we have relatively high certainty that the true is close to . Conversely, we have relatively low certainty about any feature axis along which the posterior variance is large.
We can measure the scale of the posterior distribution along an arbitrary axis in a fairly simple manner: since we know (by the above concavity arguments) that the posterior is characterized by a single ‘bump,’ and the position of the peak of this bump is already characterized by , it is enough to measure the curvature of this bump at the peak . Mathematically, we measure this curvature by computing the ‘Hessian’ matrix of second-derivatives of the log-posterior,
| (11.16) |
Moreover, the eigendecomposition of this matrix tells us exactly which axes of stimulus space correspond to the ‘best’ and ‘worst’ encoded features of the neural response: small eigenvalues of correspond to directions of small curvature, where the observed data poorly constrains the posterior distribution (and therefore the posterior variance will be relatively large in this direction), while conversely large eigenvalues in imply relatively precise knowledge of , i.e., small posterior variance (235) (for this reason the Hessian of the log-likelihood is referred to as the ‘observed Fisher information matrix’ in the statistics literature). In principle, this posterior uncertainty analysis can potentially clarify what features of the stimulus a ‘downstream’ neuron might care most about.
We can furthermore use this Hessian to construct a useful approximation to the posterior . The idea is simply to approximate this log-concave bump with a Gaussian function, where the parameters of the Gaussian are chosen to exactly match the peak and curvature of the true posterior. This approximation is quite common in the physics and statistics literature (252; 74; 437). Specifically,
| (11.17) |
with . We can then read off the approximate posterior entropy or variance of : e.g., . As discussed further in (10; 400), the approximation by the Gaussian of Eq. (11.17) is often quite accurate in the context of decoding. See (437; 400) for discussion of a related bound on the posterior entropy, which can be used to bound the mutual information between the stimulus and response.
11.3.3 Decoding in vision and neuroprosthetics
We have established that generalized integrate-and-fire can predict with good accuracy the activity of real neurons. Is it sensible to assert that we have understood how the neural system translate stimulus into patterns of action potentials? If so we should be able to read the neuronal activity to reconstruct its tangible meaning. As was briefly discussed in Section 11.3, reading the neural code has practical applications; a common example of such applications is to help tetraplegic patients to control artificial limbs. In this section, we illustrate decoding in two distinct scenarios. In the first scenario (Fig. 11.11), a monochrome movie is reconstructed from the activity of neurons in the visual pathway. In the second example (Fig. 11.12), it is the time-dependent velocities of hand movements that are decoded from activity in the area MI of the cortex.
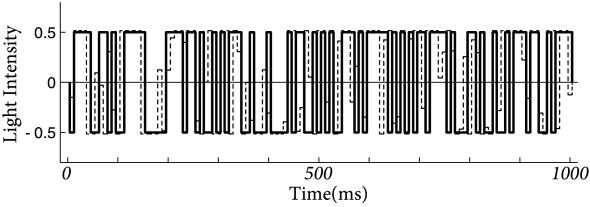
Using the methods described in Section 11.3, Pillow et al. (399) reconstructed the time-dependent light stimulus from 27 ganglion cells recorded in the retina. First, coupled integrate-and-fire models were optimized on training data (c.f. Section 11.2.2). Once the appropriate set of parameter was determined, spike trains from the data reserved for testing were used to decode the stimulus. Decoding was performed with the methods discussed in Section 11.3.
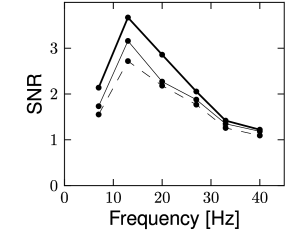
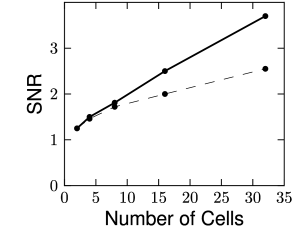
The stimulus was a spatio-temporal binary white noise. The decoding performance can be quantified by evaluating the signal-to-noise ratio for different frequencies (Fig. 11.11). For most of the frequencies, the signal-to-noise ratio of the decoded signal was above one, meaning that the decoded signal was greater than the error. For the fully coupled model discussed in 11.2.2, the signal-to-noise ratio can be higher than 3.5 for some frequencies. The decoding performance is expected to grow with the number of recorded neurons, as can be seen in Fig. 11.11C.
| A | |
|
|
| B | C |
|
 |
We now consider a second example which has application for neuroprosthetics. The ultimate aim of neuroprosthetic is the help human patients who have lost a limb. Prosthetic limbs are often available for those patients. While prosthesis work from a mechanical point of view, the intuitive control of the prosthetic device poses big challenges. One possible route of research is to read out, directly from the brain, the intentions of the user of the prosthetic device.
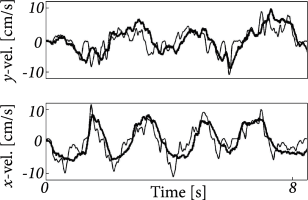
In preliminary experiments, a monkey is moving a tracking device with his hand while an electrode records from neurons of its cortex. The electrode is placed in an area associated with planning movements (131). Truccolo et al. (521) used generalized integrate-and-fire models to decode the hand movements from the recorded activity.
Again here, the first step was to fit the model parameters. The model itself was very similar to the one seen in Sect. 11.2.2 but without coupling terms and a different non-linear relation between model membrane potential and firing intensity. A more noteworthy difference is the input which consisted of hand velocity such that the receptive field mapped how the x- and y-components of the velocity influenced the driving potential.
Instead of the method described in Section 11.3, Truccolo et al. (521) used a point-process filter (136). The decoding algorithm is a recursive algorithm for calculating the Bayesian estimate of the stimulus at time in term the past activity. This recursive approach is necessary in this real-time application. The decoding performance is illustrated in Fig. 11.12. Signal-to-noise ratio for this decoding was between 1.0 and 2.5, which is rather impressive given the typical variability of cortical neurons and the small number of cells used for decoding (between 5 and 20). This exemplifies that generalized integrate-and-fire models can help building brain-machine interface for controlling prosthetics limbs by ‘reading’ the activity of cortical neurons. A number of groups are now working to further improve these methods for use in prosthetic systems.
| A | B |
|---|---|
|
 |